
Mynd:IQ curve.svg

Stærð þessarar PNG forskoðunar á SVG skránni: 600 × 480 mynddílar. Aðrar upplausnir: 300 × 240 mynddílar | 960 × 768 mynddílar | 1.280 × 1.024 mynddílar | 2.560 × 2.048 mynddílar.
Upphafleg skrá (SVG-skrá, að nafni til 600 × 480 mynddílar, skráarstærð: 9 KB)
Lýsing
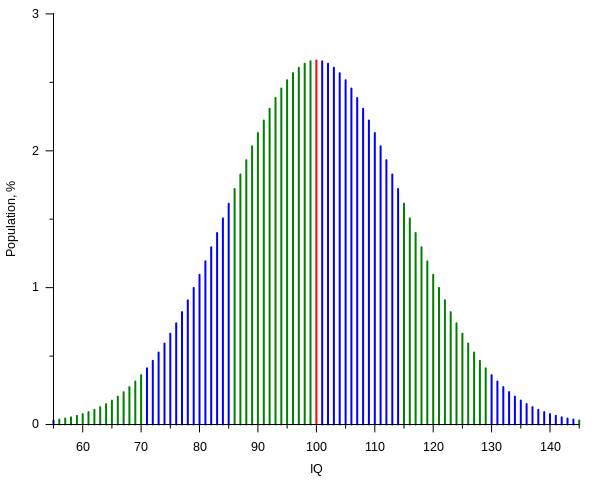
| Lýsing | Current IQ tests typically have standard scores such that the mean score is 100 with each standard deviation from the mean counting for 15 IQ points.[1] The plot shows, assuming that such scores have a normal distribution, the percentage of people getting a score versus the score itself, from 55 to 145 IQ, that is over a span of six standard deviations. Spans are represented with different colors for each standard deviation above or below the mean. The plot was created with the following gnuplot code: |
| SVG genesis | |
| Source code | Gnuplot codeset terminal svg name 'IQ_curve' size 600,480 font ',10' rounded
set output 'IQ_curve.svg'
mu = 100.0
sigma = 15.0
from = 55
to = 145
# Normal distribution:
# (continuos normalization approximation, good to ~10 digits in this case)
P(x) = exp(-(x - mu)**2 / (2 * sigma**2)) / (sqrt(2 * pi) * sigma) * 100
# By sigma intervals:
oddsi(x) = (int(abs(x - mu) / sigma) % 2) ^ (x < mu)
Pm(x) = (x == mu) ? P(x) : 1/0 # sample at mu
Po(x) = ( oddsi(x) && (x != mu)) ? P(x) : 1/0 # samples in odd sigma intervals
Pe(x) = (!oddsi(x) && (x != mu)) ? P(x) : 1/0 # samples in even sigma intervals
set key off
set border 3
set xlabel 'IQ'
set xtics 10 out nomirror
set mxtics 2
set ylabel 'Population, %'
set ytics 1 out nomirror
set mytics 2
set samples (to - from + 1)
set style function impulses
plot [x = from:to] \
Pm(x) lw 2, \
Po(x) lw 2, \
Pe(x) lw 2
|
| Dagsetning | |
| Uppruni | eigin skrá |
| Höfundarréttarhafi | Alessio Damato, Mikhail Ryazanov |
- ↑ Kaufman, A.S. (2009) IQ Testing 101, New York (NY): Springer Publishing, pp. 104−109 ISBN: 978-0-8261-0629-2.
Leyfisupplýsingar:
I, the copyright holder of this work, hereby publish it under the following licenses:

|
Gefið er leyfi til að afrita, dreifa og/eða breyta þessu skjali samkvæmt Frjálsa GNU Free Documentation License, útgáfu 1.2 eða nýrri, sem gefið er út af Frjálsu hugbúnaðarstofnuninni með engum breytingum þar á. Afrit af leyfinu er innifalið í kaflanum GNU Free Documentation License. |
| Þessi skrá er með Creative Commons Tilvísun-DeilaEins 3.0 Óstaðfært notkunarleyfi. | ||
| ||
| This licensing tag was added to this file as part of the GFDL licensing update. |
This file is licensed under the Creative Commons Attribution-Share Alike 2.5 Generic, 2.0 Generic and 1.0 Generic license.
- Þér er frjálst:
- að deila – að afrita, deila og yfirfæra verkið
- að blanda – að breyta verkinu
- Undir eftirfarandi skilmálum:
- tilvísun höfundarréttar – Þú verður að tilgreina viðurkenningu á höfundarréttindum, gefa upp tengil á notkunarleyfið og gefa til kynna ef breytingar hafa verið gerðar. Þú getur gert þetta á einhvern ásættanlegan máta, en ekki á nokkurn þann hátt sem bendi til þess að leyfisveitandinn styðji þig eða notkun þína á verkinu.
- Deila eins – Ef þú breytir, yfirfærir eða byggir á þessu efni, þá mátt þú eingöngu dreifa því verki með sama eða svipuðu leyfi og upprunalega verkið er með.
Þú mátt velja notkunarleyfi að eigin vali.
Breytingaskrá skjals
Smelltu á dagsetningu eða tímasetningu til að sjá hvernig hún leit þá út.
| Dagsetning/Tími | Smámynd | Víddir | Notandi | Athugasemd | |
|---|---|---|---|---|---|
| núverandi | 26. nóvember 2020 kl. 23:11 | | 600 × 480 (9 KB) | Paranaja | Reverted to version as of 21:27, 2 November 2012 (UTC) |
| 2. nóvember 2012 kl. 21:27 |  | 600 × 480 (9 KB) | Mikhail Ryazanov | IQ values are now integers; gnuplot-only approach | |
| 6. desember 2006 kl. 09:20 |  | 600 × 480 (12 KB) | Alejo2083 | {{Information |Description= The IQ test is made so that most of the people will score 100 and the distribution will have the shape of a Gaussian function, with a standard deviation of 15. The plot shows the percentage of people getting a score versus the |
Skráartenglar
Það eru engar síður sem nota þessa skrá.
Altæk notkun skráar
Eftirfarandi wikar nota einnig þessa skrá:
- Notkun á ar.wikipedia.org
- Notkun á ast.wikipedia.org
- Notkun á az.wikipedia.org
- Notkun á ba.wikipedia.org
- Notkun á be-tarask.wikipedia.org
- Notkun á be.wikipedia.org
- Notkun á ca.wikipedia.org
- Notkun á cs.wikipedia.org
- Notkun á da.wikipedia.org
- Notkun á de.wikipedia.org
- Intelligenzquotient
- Normwert
- Wikipedia:WikiProjekt Psychologie/Archiv
- Benutzer:SonniWP/Hochbegabung
- Kritik am Intelligenzbegriff
- The Bell Curve
- Benutzer:Rainbowfish/Bilder
- Quantitative Psychologie
- Intelligenzprofil
- Benutzer:LauM Architektur/Babel
- Benutzer:LauM Architektur/Babel/Überdurchschnittlicher IQ
- Notkun á de.wikibooks.org
- Elementarwissen medizinische Psychologie und medizinische Soziologie: Theoretisch-psychologische Grundlagen
- Elementarwissen medizinische Psychologie und medizinische Soziologie/ Druckversion
- Elementarwissen medizinische Psychologie und medizinische Soziologie/ Test
- Benutzer:OnkelDagobert:Wikilinks:Psychologie
- Notkun á de.wikiversity.org
- Notkun á en.wikipedia.org
- User:Michael Hardy
- User:Robinh
- User:Itsnotvalid
- User:M.e
- User:Quandaryus
- User:Astronouth7303
- User:Mattman723
- User:Iothiania
- User:Octalc0de
- Portal:Mathematics/Featured picture archive
- User:Dirknachbar
- User talk:BlaiseFEgan
- User:Albatross2147
- User:Klortho
- User:Kvasir
- User:Spellcheck
- User:Heptadecagram
- User:Patrick1982
- User:NeonMerlin/boxes
- User:Cswrye
Skoða frekari altæka notkun þessarar skráar.